

Bitcoin continues to drop to a new weekly low
- Bitcoin’s price attempted a recovery on Monday but was halted at the $59900 resistance level
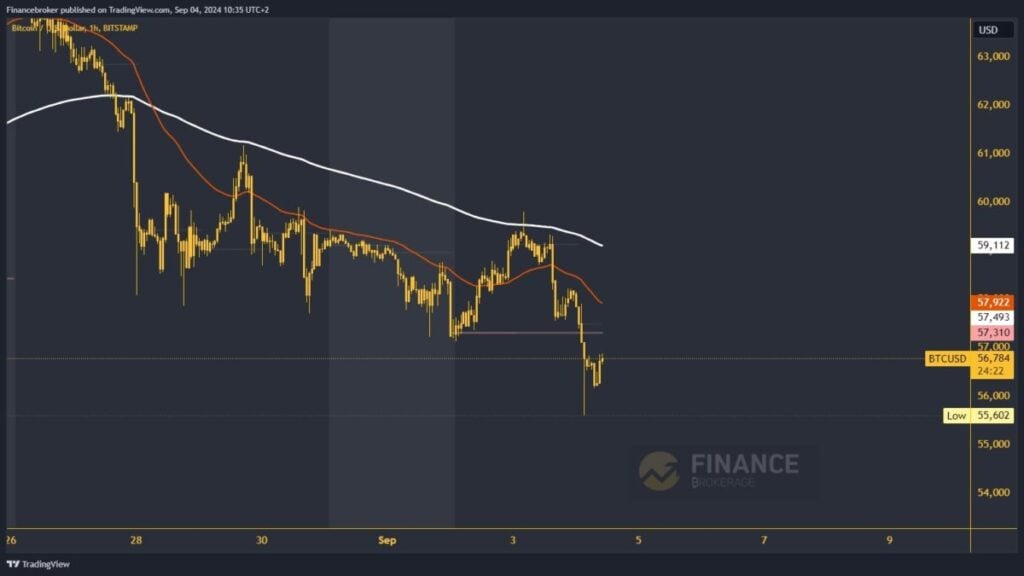
Bitcoin chart analysis
Bitcoin’s price attempted a recovery on Monday but was halted at the $59900 resistance level. Subsequently, the price retreated below $59500 and fell below the EMA 200 moving average, a key technical indicator. This increased bearish pressure, leading to another bearish consolidation. The support at $57,500 was also breached, and this morning, we witnessed a continuation of the bearish trend.
With a couple of strong impulses, the price of Bitcoin fell to the $55,602 level. Shortly after that, the price moved up to the $56,800 level. We are now moving in the $56200-$56800 range and trying to hold here. We need an impulse above the upper range line to form a new high. With a return above $57300, we would return above the weekly open price. The next goal is to stay up there and try to get back to the bullish side.
We have been in a bearish trend for ten days and are looking for a support level
If we manage to find this support, it could pave the way for a promising bullish consolidation towards the EMA 200 moving average and the $59000 level. There are potential higher targets at the $59500 and $60000 levels. On the other hand, a bearish scenario would require a negative consolidation and a pullback of the Bitcoin price below the $56000 level, bringing us closer to testing this morning’s low.
At this point, there’s a possibility of an impulse below and a price drop to a new weekly low. Potential lower targets are the $55,000 and $54,500 levels. The next lower target is the August low at $49577. It’s important to be cautious and aware of these potential outcomes.
The post Bitcoin continues to drop to a new weekly low appeared first on FinanceBrokerage.